
Information Note 1
Payroll tax in Australia is frequently singled out as having an adverse effect on businesses and the economy in general. This view has generally been guided by economists (through theory and modelling) and the business sector. Payroll tax is levied by the States against the total sum of remuneration of employees within a firm for each dollar above a threshold.
The threshold exempts small businesses from payroll tax giving them a cost advantage over larger firms. This cost advantage could encourage firms to stay small to avoid the tax, which could result in an economic distortion. More firms having total payroll expenses just below the payroll tax threshold than just above would be evidence of payroll tax being distortionary. A recent Treasury Working Paper, Does payroll tax affect the behaviour of firms?, used business income tax data from the Business Longitudinal Analysis Data Environment (BLADE) to analyse this question.
The paper found that in general firms do not bunch just below the threshold. This suggests that an expected distortion caused by payroll has not been detected empirically and that payroll tax may not be as distortionary as previously believed. However, at this point such an interpretation may be premature. The distortion could manifest in another way, such as slower growth for businesses as they approach the threshold.
Payroll tax and the policy ideal
The policy ideal to minimise the distortion is to reduce the threshold and have a low rate of payroll tax
Payroll tax is frequently singled out as having an adverse effect on businesses and the economy in general. This view has generally been guided by economists (through theory and modelling) and the business sector.
The International Monetary Fund notes that countries can reduce resource misallocation by ensuring firms’ decisions are made for business and not tax reasons. 2 In Australia, tax settings may provide a disincentive for even highly productive firms to grow and increase their market share, and thus provide a drag on aggregate productivity growth, and should be carefully examined.
Payroll tax is levied against the total sum of remuneration of employees within a firm. Remuneration includes wages, salaries and superannuation. A tax free threshold exists for payroll tax, which is called the small business exemption threshold. This threshold means that businesses with total remuneration below this threshold are not liable to pay the tax. Businesses with total remuneration above the threshold are liable for every dollar more than the threshold. Due to the operation of the small business exemption, smaller firms have a cost advantage over larger firms. This cost advantage could encourage firms to stay small to avoid the tax which could result in an economic distortion.
Payroll tax is a tax on labour, but where the legal incidence falls on firms above the threshold. A number of authors have identified the small business exemption threshold as creating an incentive for businesses to be “inefficiently small”. One manifestation of this distortion should be that there are more firms just below the threshold than just above the threshold. Put differently, firms should bunch just below the threshold. Our work empirically tests this proposition.
Payroll taxes raise a large amount of money for the various state governments. In 2015‑16 this was around $22.7 billion or about 28 per cent of total taxation revenue for the states3. As such, from a practical perspective doing away with payroll tax is an unlikely option. The policy recommendation put forward by tax economists has been to minimise the distortion created by payroll tax by reducing the small business exemption threshold and by having a low tax rate.
Each of the states set their own payroll tax rates and thresholds. This provides a testing ground to see how the different thresholds affect firm decisions. Table 1 shows that Victoria has one of the lowest thresholds and one of the lowest payroll tax rates. This suggests that for Victoria we might expect to see less bunching when compared with the other states.
| State | Payroll tax rate (%) | Payroll tax threshold ($) |
|---|---|---|
| Australian Capital Territory | 6.85 | 1,850,000 |
| New South Wales | 5.45 | 750,000 |
| Northern Territory | 5.50 | 1,500,000 |
| Queensland | 4.75 | 1,100,000 |
| South Australia | 4.95 | 600,000 |
| Tasmania | 6.10 | 1,250,000 |
| Victoria | 4.85 | 550,000 |
| Western Australia | 5.50 | 800,000 |
Source: Various state governments.
Identifying bunching
Graphical analysis can introduce unwanted subjectivity, so formal statistical testing methods are used
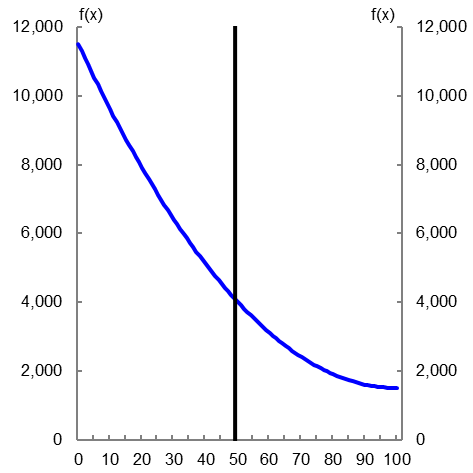
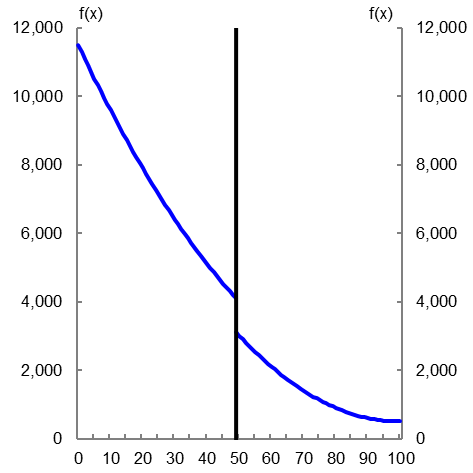
Formally, bunching is defined as a discontinuity in the probability density function of the variable of interest. Graphically, the concept is illustrated in Figures 1A and 1B. The Figures show variable (x) from zero to 100 along the horizontal axis. The threshold point is at 50 and is represented with a black line. The stylised result is shown as a blue line. In Figure 1A the blue line approaching 50 from the left and from the right is smooth so there is no bunching present. Conversely, in Figure 1B the blue line is not smooth and jumps as it approaches the threshold point and bunching is present.
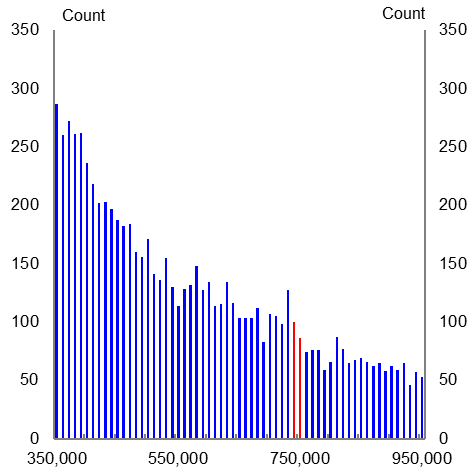
Sometimes graphical analysis can introduce unwanted subjectivity due to the size of the bins used. To illustrate the effect that the size of the bins has on the results, Charts 2A and 2B have different bin sizes. Chart 2A shows the distribution of total wages of firms in Western Australia in 2013-14 for a selected range. The bins increase by $10,000. In 2013-14 the payroll tax threshold was $750,000. The two red bars represent firms just above and just below the threshold. There is a slight difference in height between these red bars, but it is difficult to state categorically whether the difference is large enough to claim that bunching has occurred.
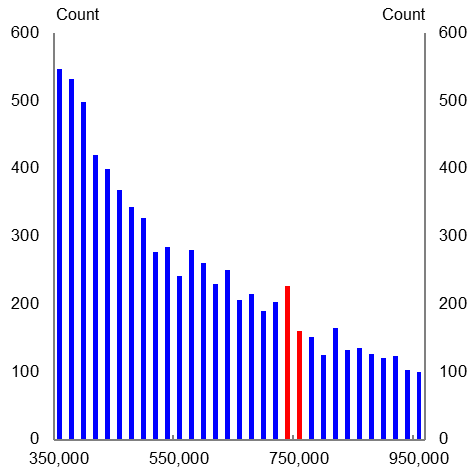
Chart 2B is the same as Chart 2A, except that the bin size is $20,000 instead of $10,000. The gap between the two red bars is much more pronounced in Chart 2B than in Chart 2A. This demonstrates that the size of the bins can influence the perception of whether bunching has occurred.
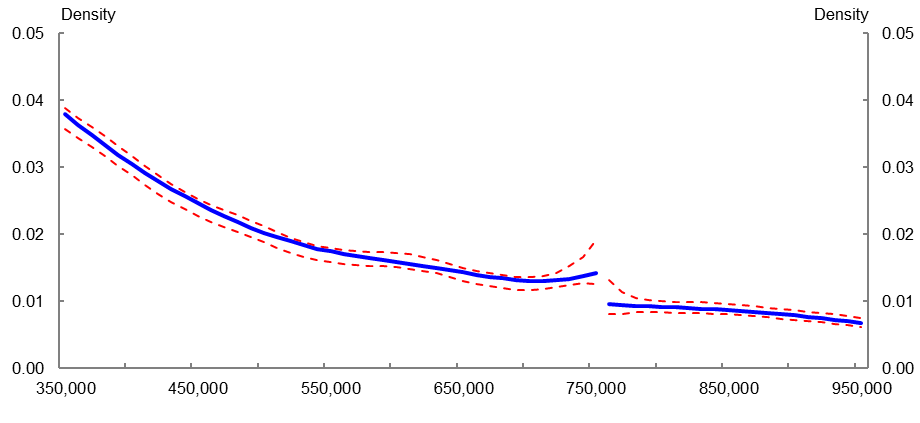
To negate this issue, formal statistical testing methods for bunching can be used. The method used in the Treasury Working Paper is akin to smoothing the observed data. The smoothing is done separately for observations above and below the cut-off threshold. As an example, the solid blue lines in Chart 2C are the smoothed data used in Charts 2A and 2B. The dashed red lines in Chart 2C represent the 95 per cent confidence interval. Notice that the solid blue line to the left of the threshold is above the upper bound, 95 per cent confidence interval indicated by the top dashed red lines to the right of the $750,000 threshold. Expressed informally, this means that the test indicates that bunching has occurred.4
Is there bunching around payroll tax thresholds?
There is little evidence of distortion in firm behaviour due to payroll tax, outside some observations for Victoria and Western Australia
In general, there does not appear to be bunching around the thresholds for payroll tax. However, there are isolated incidents where bunching appears to occur. The more robust incidents are ones that occur over consecutive years.
The table below summarises all the tests that were done. In total there were 91 tests for bunching. Of those, only 12 instances of bunching were found at the 95 per cent confidence level. The two incidents of bunching for New South Wales and Tasmania were for non‑consecutive years, suggesting that these could be random statistical fluctuations and therefore false positives.
| State | No. of tests | No. found significant* |
|---|---|---|
| New South Wales | 14 | 2 |
| Northern Territory | 9 | 0 |
| Queensland | 14 | 0 |
| South Australia | 14 | 0 |
| Tasmania | 12 | 2 |
| Victoria | 14 | 4 |
| Western Australia | 14 | 4 |
| Total | 91 | 12 |
* 95 per cent confidence interval.
The more concrete cases of bunching around the payroll tax threshold occur in Western Australia and Victoria. In Western Australia bunching is not rejected for 2010-11, 2012-13, 2013-14 and 2014-15 at the 95 per cent confidence level. In Victoria bunching is not rejected at the 95 per cent confidence level for 2010–11, 2011–12, 2012–13 and 2014–15.
The bunching in Victoria and Western Australia occurs over consecutive years. This suggests that the results are unlikely to be due to random variation, but are due to more fundamental factors. It should be noted that during this time, Victoria did not increase its threshold. However, Western Australia did increase its threshold in 2014–15 from $750,000 to $800,000.5 When the old threshold of $750,000 is tested for Western Australia in 2014–15, bunching is not found. This suggests that firms may have altered their payrolls in response to the higher payroll tax threshold.
Sensitivity analysis was conducted for these results. This analysis included a number of robustness checks, such as whether firms on either side of the threshold were fundamentally different from each other, and testing whether the Victorian and Western Australian thresholds produced similar results in other states.
The sensitivity analysis upheld the main findings that overall there was little bunching around payroll tax thresholds, but with some bunching observed in Victoria. The sensitivity analysis for Western Australia raised more questions. In particular, it was found that during the bunching period firms immediately above and below the threshold became increasingly different from each other as time went on. That is, the bunching on either side of the threshold could be due to the firms being different from each other. Alternatively, the firms could be different to each other due to payroll tax.
Another interesting finding from the robustness checks is that there appears to be no significant difference between firm hiring rates of contractors immediately below and immediately above the threshold. This suggests that firms do not attempt to avoid payroll tax by hiring contractors.
The results suggest that in general bunching around the payroll tax thresholds is not an issue for most states. This is juxtaposed against the instances where bunching has occurred. One possible reason why bunching may have been observed is that Victoria had its payroll tax threshold in place for nine years before bunching started to occur and it may take time for many firms to start structuring their operations around this aspect of the policy. However, Tasmania had the same threshold in place for 11 years (2003 to 2013) and consecutive bunching was not observed, so this possible explanation is not very compelling.
Two possible explanations are offered for the general lack of bunching. First, the incidence of the tax falls on employees, so firms may do little to avoid the tax. And second the marginal cost of the tax is quite low, so efforts to avoid it may not be worthwhile compared with the benefits of adequately staffing a growing business. These explanations might explain the general observation, but it is hard to reconcile why Victoria should be different after 2010-11. They also run counter to liaison with small businesses which, though anecdotal, often includes reports that payroll tax is an important issue.
Conclusion
Future work might also examine behaviour further below the thresholds
The results show that in general there was not a concentration of firms just below the payroll tax thresholds in most states and in most years. There are some instances of bunching recorded for Victoria and Western Australia. This is despite Victoria following what would be considered the general policy prescription of low thresholds and low rates. Bunching also occurred in Western Australia despite an increase in its threshold in 2015.
These results suggest that in general there is little change in the behaviour of firms around payroll tax thresholds. However, firms could still be altering behaviour in the lead up to the threshold. This would then result in no bunching around the threshold itself, but firms operating below an efficient level. To try and understand whether this is the case, additional analysis could be done to see whether firms alter their behaviour leading up to and/or beyond the payroll tax threshold. For example, this change in behaviour could be captured in the growth rate of taxable wages for payroll tax purposes when firms are still some distance below the threshold.
Finally, it should be noted that these results are for the period 2001–02 to 2014–15. The results may not hold for other periods. To see if these same results hold in general, more advanced techniques would be needed (such as a structural model).
ABS data disclaimer
The results of these studies are based, in part, on ABR data supplied by the Registrar to the ABS under A New Tax System (Australian Business Number) Act 1999 and tax data supplied by the ATO to the ABS under the Taxation Administration Act 1953. These require that such data is only used for the purpose of carrying out functions of the ABS. No individual information collected under the Census and Statistics Act 1905 is provided back to the Registrar or ATO for administrative or regulatory purposes. Any discussion of data limitations or weaknesses is in the context of using the data for statistical purposes, and is not related to the ability of the data to support the ABR or ATO’s core operational requirements. Legislative requirements to ensure privacy and secrecy of this data have been followed. Only people authorised under the Australian Bureau of Statistics Act 1975 have been allowed to view data about any particular firm in conducting these analyses. In accordance with the Census and Statistics Act 1905, results have been confidentialised to ensure that they are not likely to enable identification of a particular person or organisation.
[1] The views expressed in this note are those of The Treasury and do not necessarily reflect those of the Australian Government. This note was prepared by Ben Ralston in Macroeconomic Group.
[2] IMF Fiscal Monitor: Achieving More with Less, April 2017.
[3] See ABS catalogue no. 5506.0.
[4] The tests conducted are one-tailed tests because the concern is whether bunching occurs below the threshold.
[5] Western Australia announced the increase in the 2014-15 threshold in the 2013-14 Budget on 8 August 2013.